
Support Vector Regression:
Support Vector Machine can also be used as a regression method, maintaining all the main features that characterize the algorithm (maximal margin).
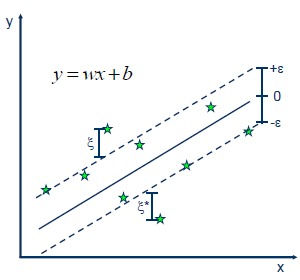
The Support Vector Regression (SVR) uses the same principles as the SVM for classification, with only a few minor differences.
First of all, because output is a real number it becomes very difficult to predict the information at hand, which has infinite possibilities. In the case of regression, a margin of tolerance (epsilon) is set in approximation to the SVM which would have already requested from the problem.
But besides this fact, there is also a more complicated reason, the algorithm is more complicated therefore to be taken in consideration.
However, the main idea is always the same: to minimize error, individualizing the hyperplane which maximizes the margin, keeping in mind that part of the error is tolerated.
Project | 04
Project | 04 Support Vector Regression (SVR)
# Importing the libraries
import numpy as np
import matplotlib.pyplot as plt
import pandas as pd
# Importing the dataset
dataset = pd.read_csv('Position_Salaries.csv')
X = dataset.iloc[:, 1:-1].values
y = dataset.iloc[:, -1].values
print(X)
print(y)
y = y.reshape(len(y),1)
print(y)
# Feature Scaling
from sklearn.preprocessing import StandardScaler
sc_X = StandardScaler()
sc_y = StandardScaler()
X = sc_X.fit_transform(X)
y = sc_y.fit_transform(y)
print(X)
print(y)
# Training the SVR model on the whole dataset
from sklearn.svm import SVR
regressor = SVR(kernel = 'rbf')
regressor.fit(X, y)
# Predicting a new result
sc_y.inverse_transform(regressor.predict(sc_X.transform([[6.5]])))
# Visualising the SVR results
plt.scatter(sc_X.inverse_transform(X), sc_y.inverse_transform(y), color = 'red')
plt.plot(sc_X.inverse_transform(X), sc_y.inverse_transform(regressor.predict(X)), color = 'blue')
plt.title('Truth or Bluff (SVR)')
plt.xlabel('Position level')
plt.ylabel('Salary')
plt.show()